Fault-tree-analysis (FTA)
Within risk management it is important to understand the risk of critical occurrences be able to prioritize well and decide right. FTA is a great tool to approach it.
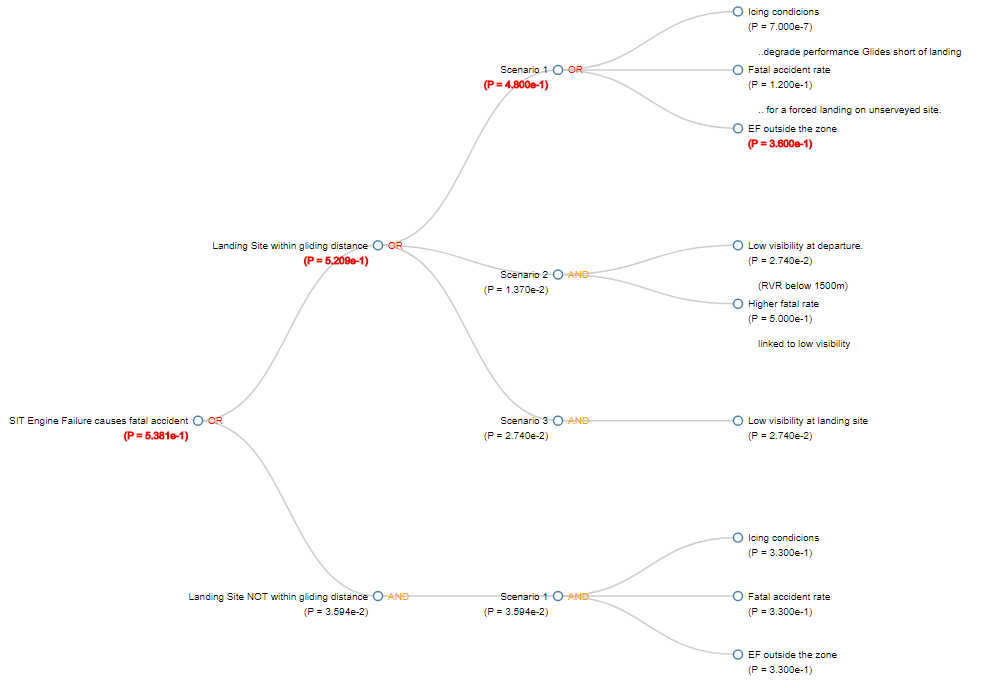
https://herwigs.info/joachim/projects/fta/ renders a fault tree and calculates the probability of the occurance of critical errors which are hard to estimate directly.
To archieve this within a fault tree analysis, you try figure out all causes which might be relevant for leading to such a fatal event to smaller cases.
The combination („one-of“ = ∨ or „all-apply“ = ∧) of those easier to estimate risks are reverse traversed to calculate the risk of the fatal event.
An example:
The European Aviation Safety Agency used this to the minimize the risk of fatalities due to engine failures on single engine planes in commercial flights. This was part of the process to allow the useage of SET – planes like Pilatus PC12, Quest Kodiaq, Cessna 208T etc. for commercial flights.
By simply generating a structure to enter your estimations in a machine readable form, and having algorithms to calculate and draw the fault tree analysis and show you the most critical path i generated a system that makes it easy to figure out which risks need to be eliminated to get the most promising result in reducing a fatal fault.
Whenever possible i try to avoid unneccesary jobs. Drawing the fault tree has to happen by algorithms only based on the input data.
The input data i wanted to get should be infinitely extendable in the same structure.
{
  "swagger": "2.0",
  "info": {
    "version": "0.0.1",
    "title": "Fault-Tree-Analysis",
    "description": ""
  },
  "schemes": [
    "https"
  ],
  "consumes": [
    "application/json"
  ],
  "produces": [
    "application/json"
  ],
  "host": "api.fta.joachim.herwigs.info",
  "paths": {
    "/fta": {
      "post": {
        "description": "",
        "summary": "Post your fault-tree definition to this route, to get the calculated fault-tree as response.",
        "parameters": [{
            "$ref": "#/parameters/authorization"
          },
          {
            "in": "header",
            "name": "output-format",
            "description": "The format in which the fault tree is rendered, after its complete calculation.",
            "type": "string",
            "default": "json",
            "enum": [
              "json",
              "xml",
              "svg",
              "pdf-tabular",
              "pdf-report"
            ]
          },
          {
            "in": "body",
            "name": "fault-tree",
            "description": "The data to be analyzed.",
            "required": true,
            "schema": {
              "$ref": "#/definitions/fault"
            }
          }
        ],
        "responses": {
          "200": {
            "description": "OK! responds the requested data <br/>The example shows the json output.",
            "schema": {
              "$ref": "#/definitions/fault"
            }
          },
          "204": {
            "description": "No data!<br/>The given fault tree could not be calculated completely. Some of the leave-nodes don't have a proper probability or the fault-tree json was no valid fault-tree-object."
          },
          "403": {
            "description": "Forbidden!<br/>The given user doesn't have any rights to access the requested data."
          }
        },
        "tags": [
          "fault-tree-analysis"
        ]
      }
    }
  },
  "parameters": {
    "authorization": {
      "name": "authorization",
      "description": "Used to identify the user accessing the API. For testpurposes a static token - wich never expires - is used to get static test-data so that developers are able to develop and test against this ressource.",
      "in": "header",
      "required": true,
      "type": "string"
    }
  },
  "definitions": {
    "fault": {
      "type": "object",
      "description": "A fault-tree-node",
      "required": [
        "name"
      ],
      "properties": {
        "name": {
          "description": "The displayed name of the fault node",
          "type": "string"
        },
        "description": {
          "description": "A longer description for this fault node, which is rendered as tooltip.",
          "type": "string"
        },
        "gate": {
          "description": "Defines whether the children are treated as \"one-of\" (OR) or \"all-match\" (AND) for the calculation of the aggregated probabilities.",
          "type": "string",
          "default": "OR",
          "enum": [
            "AND",
            "OR"
          ]
        },
        "probability": {
          "type": "number",
          "description": "Used to define the probability of the occurance of the node's event. Usually the probability is estimated over a given time period (eg. downtime per year | events per flight hour) The parameter is numeric an can be set either as integer (2), float (0.0043) or exponent (43e-3)."
        },
        "children": {
          "type": "array",
          "description": "inherits an array of fault nodes. (Infinite self-recursion). If a node doesn't have any children it has to contain estimated probability of it's occurance.",
          "items": {
            "$ref": "#/definitions/fault"
          }
        }
      }
    }
  }
}
Check the Example which was generated based on the Fault Tree Analytics made for the approval of granting the use of single engine turbine equipped aircraft for commercial operations within IMC and night conditions. (http://eur-lex.europa.eu/legal-content/EN/TXT/HTML/?uri=CELEX:32017R0363&from=EN)

Ensure to enable CORS in your Browser if you want to use external file definitions via the URL-Parameter ?url=https://mydomain.org/FaultTreeAnalysis/myCase.json
See example
https://herwigs.info/joachim/projects/fta/
renders a fault tree and calculates the probability of the occurance of critical errors which are hard to guess directly.
Of course you can use it also to calculate the churn rate of your employees / customers based on statistical information of some relevant contributing factors.
See the churn rate example.
payment automation
portable-sim-panels
Das könnte dich auch interessieren

JOESIMTECH is Prepar3D!

Automatic release-note and test guide creation in TFS